Desmos: Generating Straight Lines 3
In part 1 you used the Desmos API to create an app that generates random straight lines on a set of axes. In part 2 you extended the app to include sets of lines, with buttons to navigate from line to line.
In this tutorial, part 3, you generate lines that pass through two randomly selected points whose x values are no longer restrained to 0 and 1.
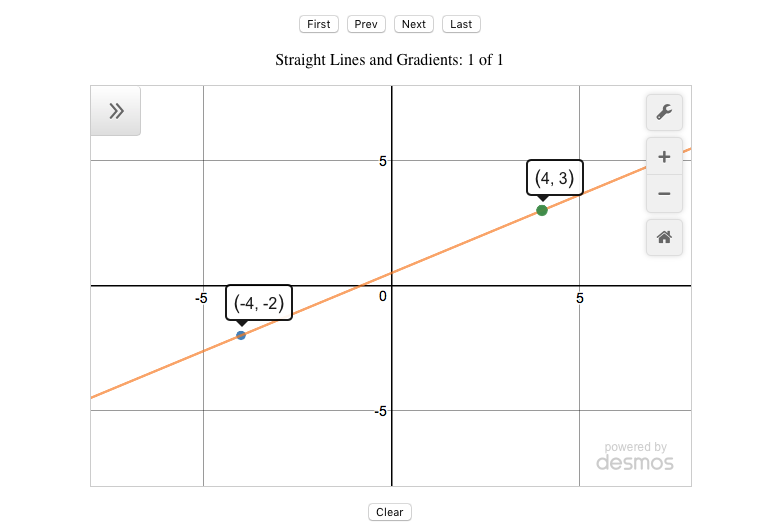
The finished app is shown in the figure below and you can see part 3 in action on JS Bin.
Generating a wider range of possible points leads to a wider range of possible equations for the lines. The equations may now contain fractions, as shown in the expressions list below.
You want the fractions in the equations of the lines to be in their simplest form, so you'll start by investigating how to call helpful calculator functions behind the scenes.
Using Calculator Functions
As a scientific calculator, Desmos provides a whole host of mathematical functions. For example, to calculate the greatest common divisor (highest common factor) of six and ten, type gcd(6, 10) into the expressions list. Desmos displays the result, 2, as shown below.
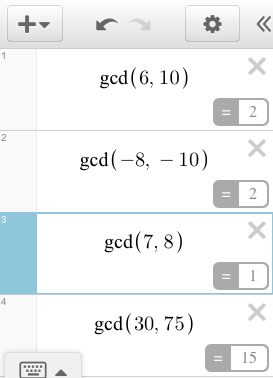
The greatest common divisor of a set of integers, is the largest integer that divides into all of the numbers in the set, without remainder. It is the highest factor common to all of the numbers.
Helper Expressions
You've seen, in previous parts of this tutorial, how to add expressions to the expressions list using setExpression. Sometimes, you may want to use the calculator functions in your code but not display them to the user. Desmos provides helper expressions for that purpose.
The following listing shows how to create a helper expression that uses the gcd function discussed earlier. Running the code produces the output 2 on the console.
var calculator = Desmos.GraphingCalculator();

var helper = calculator.HelperExpression({
    latex: '\\gcd(6, 10)'
});

helper.observe('numericValue', function () {
    console.log(helper.numericValue);
});
You use LaTeX to specify the expression. In LaTeX, the calculator functions are preceded by a backslash - so to use gcd, for example, you use \gcd(6, 10). However, in JavaScript, a backslash denotes the start of an escape sequence (used to denote special characters like line breaks, tabs and so on). So, you use a double backslash to denote the escape sequence that represents an actual backslash character: \\gcd(6, 10).
But, how do you access the result of the helper calculation? You observe the helper's numericValue property. When the calculator updates the value, it calls a function you provide.
// observe the helper's numericValue property
helper.observe('numericValue', function () {

    // use the updated value
    console.log(helper.numericValue);

});
Desmos processes calculations in the background (using web workers) so that the user interface isn't locked up by potentially time-consuming algorithms. Once the result is available it invokes the callback function you provide. In the callback function, you can access the freshly calculated value.
In the line generator app, you want to show equations of lines that include fractions in their simplest form. The next section investigates simplifying fractions.
Simplifying Fractions
To simplify a fraction, divide both the numerator (the top) and the denominator (the bottom) by their greatest common divisor. For example, for 6/10:
- The numerator is 6 and the denominator is 10.
- The greatest common divisor of 6 and 10 is 2.
- 6 divided by 2 is 3 and 10 divided by 2 is 5.
- 6/10 simplifies to become 3/5.
In the next listing, you create a frac function that displays simplified fractions in the calculator expressions list, as shown in this figure:
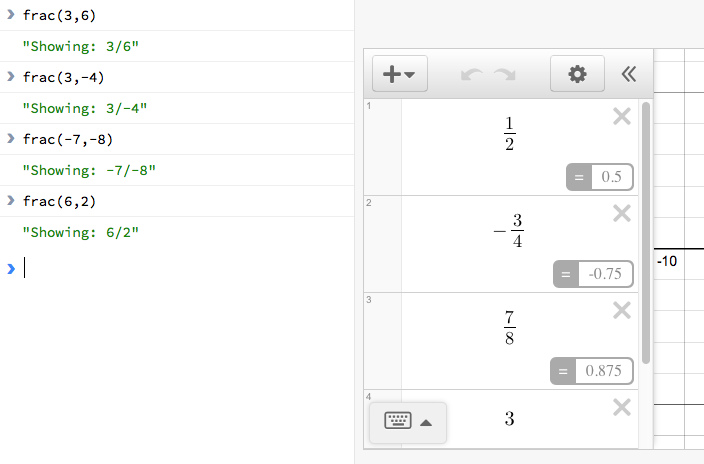
You call the function from the console. frac(3, 6) displays 1/2 on the Desmos calculator. Follow the link to the working code on JS Bin, run the program, and try out some fractions of your own.
var elt = document.getElementById('calculator');
var calculator = Desmos.GraphingCalculator(elt);

function between (a, b) {
    var range = b - a + 1;
    return a + Math.floor(Math.random() * range);
}

function frac (num, den) {

    var helper = calculator.HelperExpression({
        latex: '\\gcd(' + num +',' + den +')'
    });

    helper.observe('numericValue', function () {
        var fracString = num * den < 0 ? '-' : '';

        num = Math.abs(num / helper.numericValue);
        den = Math.abs(den / helper.numericValue);

        if (den === 1) {
            fracString += num;
        } else {
            fracString += '\\frac{' + num + '}{' + den + '}';
        }

        calculator.setExpression({
            latex: fracString
        });
    });
}The frac function converts 3/-4 into -3/4 and -7/-8 into 7/8. If exactly one of the numerator and denominator is negative, the whole fraction is negative. If both numerator and denominator are the same sign, then the fraction is positive. The program accounts for those possibilities by checking if num * den is negative:
var fracString = num * den < 0 ? '-' : '';If num * den is negative then exactly one of num and den is negative and the whole fraction is negative. In that case, the function initialises fracString with a leading negative sign, -. Otherwise, it assigns an empty string.
When the helper expression has calculated the greatest common divisor of the numerator and denominator, it sets the result as its own numericValue property. Both num and den are then divided by that value, simplifying the fraction. Math.abs is used to return the absolute value; only positive values are needed as fracString has already been initialised with a leading negative sign, -, if necessary.
num = Math.abs(num / helper.numericValue);
den = Math.abs(den / helper.numericValue);
If the denominator is 1, then the fraction is really a whole number equal to the numerator. 3/1 is 3, for example.
If the denominator is not 1, then the number is formatted as a fraction using LaTeX. Fractions in LaTeX are of the form \frac{numerator}{denominator}.
fracString += '\\frac{' + num + '}{' + den + '}';Although the frac function above displays the simplified fraction directly as an expression in the Desmos expressions list, it would be more flexible if it returned the LaTeX string. You could then use the string as you see fit. That's the approach taken in the getFractionString function below as you return to the line generator app and make use of your helper expression knowledge.
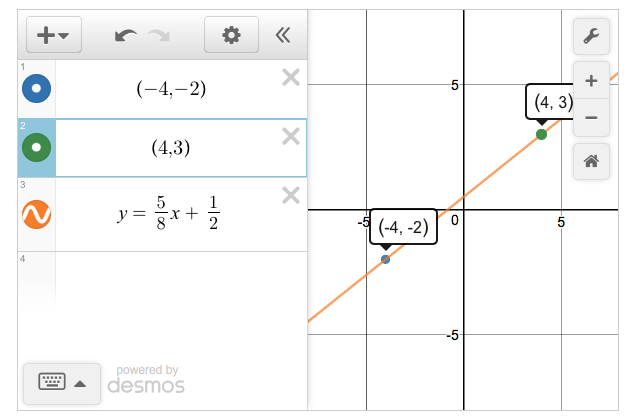
The Line Generator App, Version 3
Here's the figure of the latest version of the app in action. Notice the third expression is the equation of a straight line, and includes two simplified fractions.
There is a fraction for the gradient (the slope), 5/8, and a fraction for the y-intercept, 1/2. But, where do these fractions come from? The program creates two points at random, (-4, -2) and (4, 3) in the figure, and then calculates the gradient and y-intercept using those points.
You'll look at selected functions in a moment. But, first, here's the full listing.
(function () {
    "use strict";

    var calculator;
    var pointsCollection;
    var qIndex;

    function between (a, b) {
        var range = b - a + 1;
        return a + Math.floor(Math.random() * range);
    }

    function getPoints () {
        var p1 = { x:0, y:0 };
        var p2 = { x:0, y:0 };

        while (p1.x === p2.x && p1.y === p2.y) {
            p1.x = between(-5, 5);
            p1.y = between(-5, 5);
            p2.x = between(-5, 5);
            p2.y = between(-5, 5);
        }

        return [ p1, p2 ];
    }

    function getFractionString (num, den, cb) {

        var helper = calculator.HelperExpression({
            latex: '\\gcd(' + num +',' + den +')'
        });

        helper.observe('numericValue', function () {
            var fracString = num * den < 0 ? '-' : '';

            num = Math.abs(num / helper.numericValue);
            den = Math.abs(den / helper.numericValue);

            if (den === 1) {
                fracString += num;
            } else {
                fracString += '\\frac{' + num + '}{' + den + '}';
            }

            cb(fracString);
        });
    }

    function getGradientInfo (points) {
        var dy = points[1].y - points[0].y;
        var dx = points[1].x - points[0].x;

        return {
            dy: dy,
            dx: dx,
            isZero: dy === 0 && dx !== 0,
            isUndefined: dx === 0,
            yIntNum: points[0].y * dx - points[0].x * dy
        };
    }

    function pointString (point) {
        return '(' + point.x + ', ' + point.y + ')';
    }

    function lineString (points, cb) {
        var info = getGradientInfo(points);

        if (info.isUndefined) {
            cb('x = ' + points[0].x);
        } else if (info.isZero) {
            cb('y = ' + points[0].y);
        } else {

            getFractionString(info.dy, info.dx, function (gradient) {
                getFractionString(info.yIntNum, info.dx, function (yInt) {
                    var lineString = 'y = ' + gradient + 'x + ' + yInt;

                    lineString = lineString
                        .replace(' 1x', 'x')
                        .replace('-1x', '-x')
                        .replace(' + -', ' - ')
                        .replace(' + 0', '');

                    cb(lineString);
                });
            });
        }
    }

    function showLine () {

        var points = pointsCollection[qIndex];

        calculator.setMathBounds({
            left: - 8,
            right: 8,
            bottom: -8,
            top: 8
        });

        lineString(points, function (line) {
            calculator.setExpression({id:'line', latex:line});
        });

        points.forEach(function (point, i) {
            calculator.setExpression({id: 'point' + i, latex: pointString(point)});
        });
    }

    function setTitle () {
        var title = 'Straight Lines and Gradients: ';
        var desmosTitle = document.getElementById('desmosTitle');

        if (pointsCollection.length) {
            title += (qIndex + 1) + ' of ' + pointsCollection.length;
        } else {
            title += 'click Next to create a new line'
        }

        desmosTitle.innerText = title;
    }

    function render () {
        showLine();
        setTitle();
    }

    function next () {
        if (qIndex === pointsCollection.length - 1) {
            pointsCollection.push(getPoints());
        }

        qIndex++;
        render();
    }

    function prev () {
        if (qIndex > 0) {
            qIndex--;
            render();
        }
    }

    function first () {
        if (pointsCollection.length) {
            qIndex = 0;
            render();
        }
    }

    function last () {
        if (pointsCollection.length) {
            qIndex = pointsCollection.length - 1;
            render();
        }
    }

    function clear () {
        qIndex = -1;
        pointsCollection = [];
        setTitle();

        calculator.removeExpressions([
            { id: 'point0' },
            { id: 'point1' },
            { id: 'line' }
        ]);
    }

    function init () {
        var elt = document.getElementById('calculator');

        calculator = Desmos.GraphingCalculator(elt, {
            expressionsCollapsed: true
        });

        calculator.updateSettings({
            xAxisMinorSubdivisions: 1,
            yAxisMinorSubdivisions: 1,
            yAxisStep: 1,
            xAxisStep: 1
        });

        qIndex = -1;
        pointsCollection = [];

        document.getElementById('btnNext').addEventListener('click', next);
        document.getElementById('btnPrev').addEventListener('click', prev);
        document.getElementById('btnFirst').addEventListener('click', first);
        document.getElementById('btnLast').addEventListener('click', last);
        document.getElementById('btnClear').addEventListener('click', clear);
    }

    init();
})();Much of the app is unchanged from part 2. Below, you'll look at:
- Generating two random points.
- Calculating the gradient and y-intercept info for the line.
- Simplifying the fractions for the gradient and the y-intercept.
- Creating the LaTeX string for the line's equation.
- Updating the line expression on the calculator.
Generating Two Random Points
In parts 1 and 2, you created two points, one with an x-value of 0 and one with an x-value of 1. You also made sure that the gradient of the line through those two points was a whole number. With those restrictions removed, you are free to choose your points anywhere on the grid.
function getPoints () {
    var p1 = { x:0, y:0 };
    var p2 = { x:0, y:0 };

    while (p1.x === p2.x && p1.y === p2.y) {
        p1.x = between(-5, 5);
        p1.y = between(-5, 5);
        p2.x = between(-5, 5);
        p2.y = between(-5, 5);
    }

    return [ p1, p2 ];
}
The getPoints function returns an array of two distinct points whose x- and y-values are between -5 and 5.
Calculating the Gradient and Y-Intercept
The gradient of the line through the two points could now be a fraction (it'll probably be a fraction). It could be zero. It could be undefined - if the x-values of the two points are the same. In order to display the gradient as a fraction, you need the 'change in y' and 'change in x' of the gradient as separate values.
function getGradientInfo (points) {
    var dy = points[1].y - points[0].y;
    var dx = points[1].x - points[0].x;

    return {
        dy: dy,
        dx: dx,
        isZero: dy === 0 && dx !== 0,
        isUndefined: dx === 0,
        yIntNum: points[0].y * dx - points[0].x * dy
    };
}
The getGradientInfo function returns an object with useful properties relating to the equation of the line through two points.
Before simplification, the gradient of the line will be dy/dx. The constant part of the equation (often called the y-intercept) will be yIntNum/dx. Any point on the line will satisfy p.y = p.x * dy/dx + yIntNum/dx. (That's just y = mx + c with fractions for m and c). Rearranged, you have yIntNum = p.y * dx - p.x * dy.
Simplifying the Fractions
You want to simplify the fractions for both the gradient and the y-intercept. You use the getFractionString function below, an updated version of frac from earlier in this tutorial.
function getFractionString (num, den, cb) {

    var helper = calculator.HelperExpression({
        latex: '\\gcd(' + num +',' + den +')'
    });

    helper.observe('numericValue', function () {
        var fracString = num * den < 0 ? '-' : '';

        num = Math.abs(num / helper.numericValue);
        den = Math.abs(den / helper.numericValue);

        if (den === 1) {
            fracString += num;
        } else {
            fracString += '\\frac{' + num + '}{' + den + '}';
        }

        cb(fracString);
    });
}
You pass the getFractionString a callback function as its third argument. When the helper expression has returned the greatest common divisor, the function builds a LaTeX string and invokes the callback function, passing along the string for the fraction.
Creating the LaTeX String for the Whole Equation
There are three possible forms for the equation of your line:
- x = c if the gradient is undefined. (A 'vertical' line)
- y = c if the gradient is zero. (A 'horizontal' line)
- y = mx + c if the gradient is a non-zero integer or fraction.
For the third possibility, you want to get simplified versions of the gradient and y-intercept before constructing the expression for the straight line. That's what your getFractionString function is for!
function lineString (points, cb) {
    var info = getGradientInfo(points);

    if (info.isUndefined) {
        cb('x = ' + points[0].x);
    } else if (info.isZero) {
        cb('y = ' + points[0].y);
    } else {

        getFractionString(info.dy, info.dx, function (gradient) {
            getFractionString(info.yIntNum, info.dx, function (yInt) {
                var lineString = 'y = ' + gradient + 'x + ' + yInt;

                lineString = lineString
                    .replace(' 1x', 'x')
                    .replace('-1x', '-x')
                    .replace(' + -', ' - ')
                    .replace(' + 0', '');

                cb(lineString);
            });
        });
    }
}
Once getFractionString has returned the simplified gradient, you call it again to get the simplified y-intercept. Finally, you build the expression for the straight line through your two points.
The lineString function also tidies up the expression to look more like a conventional equation. For example, y = 1x + 0 is replaced by y = x. The function then invokes a callback, passing the polished expression back to the calling code. But what calls the lineString function? That would be showLine.
Updating the Expression
When the user navigates to an existing line or creates a new line, the line generator app calls the showLine function to update the calculator display.
function showLine () {

    var points = pointsCollection[qIndex];

    calculator.setMathBounds({
        left: - 8,
        right: 8,
        bottom: -8,
        top: 8
    });

    lineString(points, function (line) {
        calculator.setExpression({id:'line', latex:line});
    });

    points.forEach(function (point, i) {
        calculator.setExpression({id: 'point' + i, latex: pointString(point)});
    });
}
To generate the equation of the straight line, you call the lineString function (in bold above). You pass it a callback function. It invokes the callback function with the LaTeX expression for the straight line. You then set the expression on the calculator, updating the display.
What's next?
That's it for part 3! You've built a usable classroom tool and seen how to use Desmos helper expressions to perform calculations in the background of your app.
Can you give users options for the app, to let them select if they want fractional coefficients or not? What other calculator functions would be useful, more generally?
Find out more about Desmos
See the calculator (and a lot more) in action at desmos.com
Investigate the API at desmos.com/api
Get Programming with JavaScript
Keep learning! Get Programming with JavaScript is my new book, published by Manning and available in print and as an ebook.