Desmos: Generating Straight Lines 2
In part 1 you used the Desmos API to create an app that generates random straight lines on a set of axes. Clicking the Next button generates a new line. The finished app is shown in the figure below and you can see part 1 in action on JS Bin.
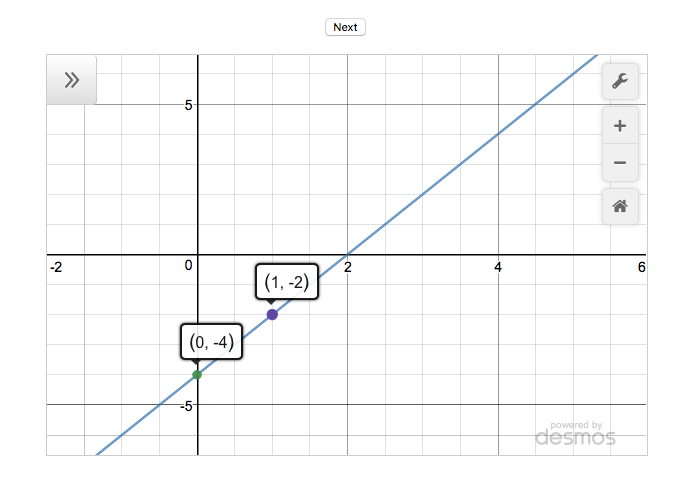
In this tutorial, part 2, you add the ability to create a set of random straight lines and navigate between them. In a lesson you might show five lines, one by one, and ask the pupils to write down the equations on their whiteboards, before discussing each question only after all the lines have been shown.
The figure below shows the updated app with the calculator displaying the fourth line out of a set of four.
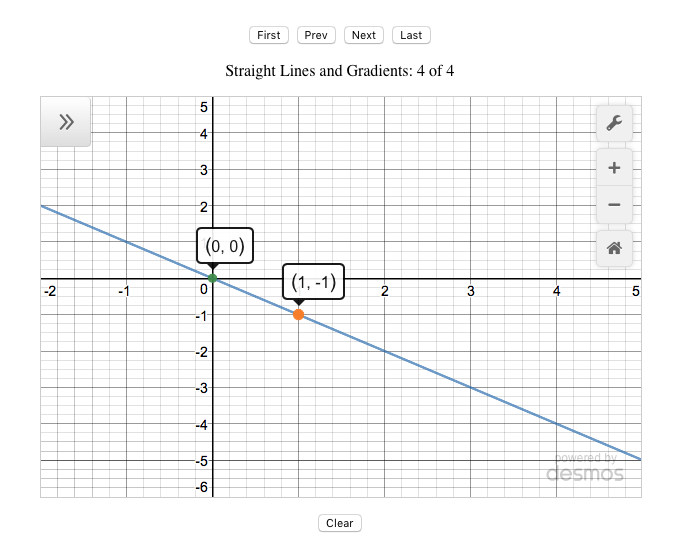
The figure also shows the extra buttons for navigating between the lines in a generated set: First, Prev, Last and Clear. See the new version in action on JS Bin.
This tutorial is in two main parts:
- Customising the Desmos calculator, updating settings and setting bounds
- Adding the navigation buttons and functions.
Let's get started by learning a little more about setting up the calculator.
Customising the Calculator
When you created a new Desmos calculator in part 1, it appeared on the page with its empty expressions list showing:
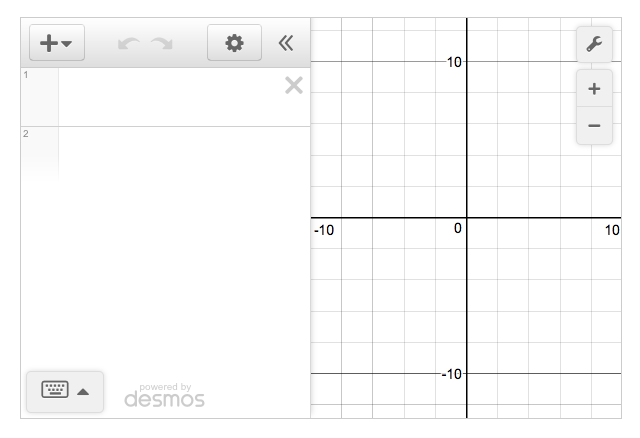
The calculator also displayed a number of buttons and controls around its edge.
You can change the appearance of a new calculator by setting options when you create it.
var elt = document.getElementById('calculator');

calculator = Desmos.GraphingCalculator(elt, {
    expressionsCollapsed: true
});
In the listing above, you create a new calculator, passing the Desmos.GraphingCalculator method two arguments: an element in which to show the calculator and a JavaScript object literal with options you want to set. The second argument, the object literal, looks like this:
{
    expressionsCollapsed: true
}
You set the options as key-value pairs. In the previous example, you set one option, hiding the expressions list. There are lots of other options you can set and the next example hides most of the default calculator buttons and controls to give this bare-bones output:
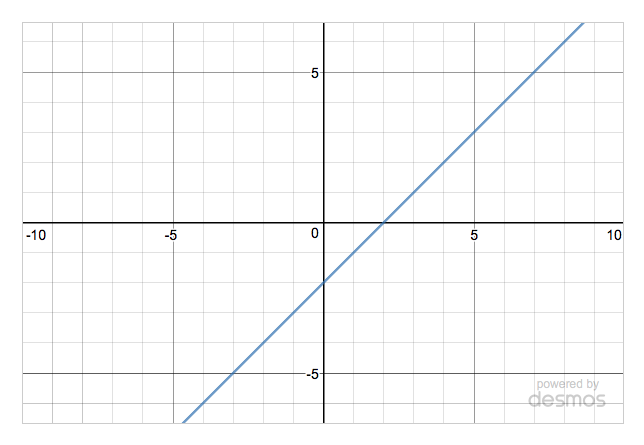
The options object now has four properties set:
var elt = document.getElementById('calculator');

calculator = Desmos.GraphingCalculator(elt, {
    keypad: false,
    expressions: false,
    settingsMenu: false,
    zoomButtons: false
});

calculator.setExpression({id: 'line1', latex: 'y=x-2'});Get stuck in on JS Bin: switch the values from false to true, and try setting other available options.
Customising the Axes
Having specified which controls to show for your calculator, you may also want to set up the graph axes exactly as you want them. Do you want labels? Grid lines? Arrows? Use the updateSettings method to apply your requirements.
In the next listing you hide the grid lines while enabling projector mode, as shown in this figure:
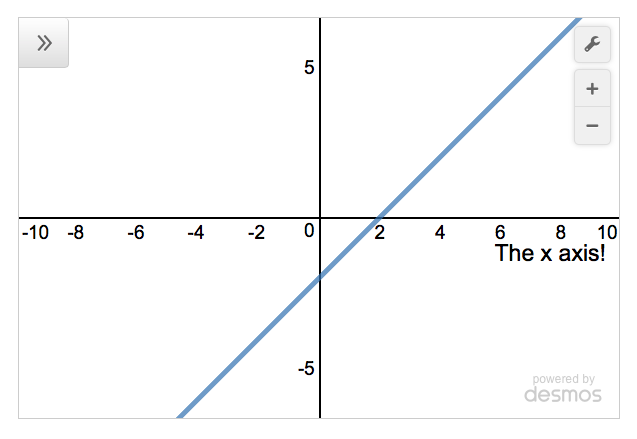
Notice, you've also set the size of the steps on the x-axis and given it a custom label, "The x axis!"
var elt = document.getElementById('calculator');

calculator = Desmos.GraphingCalculator(elt, {
    expressionsCollapsed: true
});

calculator.updateSettings({
    showGrid: false,
    projectorMode: true,
    xAxisLabel: 'The x axis!',
    xAxisStep: 2
});

calculator.setExpression({id: 'line1', latex: 'y=x-2'});There are plenty more settings for you to play with, so head over to JS Bin and experiment!
It's also possible to set the bounds for the axes, the lowest and highest values that will be displayed. The following figure shows the x-axis ranging from -2 to 5 and the y-axis from -4 to 5.
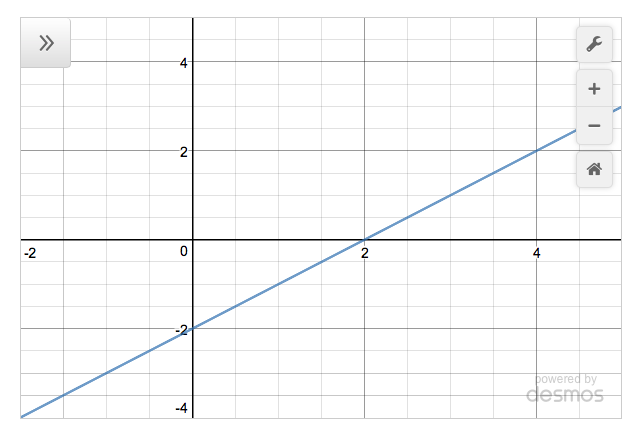
This listing shows how to use the setMathBounds method to set values for the left, right, top and bottom properties.
var elt = document.getElementById('calculator');

calculator = Desmos.GraphingCalculator(elt, {
    expressionsCollapsed: true
});

calculator.setMathBounds({
    left: -2,
    right: 5,
    bottom: -4,
    top: 5
});

calculator.setExpression({id: 'line1', latex: 'y=x-2'});Okay, now you've seen how to tweak the Desmos calculator to suit your needs, it's time to get on with the show and update the app!
Updating the line generator: Step-by-step
To update the line generator app, you'll follow these steps:
- Declare variables to store the line info and the index of the current line
- Add functions to navigate between stored lines
- Add buttons to call the navigation functions
- Define a render function to update the display
Here's the full code listing; I'll discuss selected sections in the relevant steps.
Desmos Line Generator App 2
(function () {
    "use strict";

    var calculator;
    var pointsCollection;
    var qIndex;

    function between (a, b) {
        var range = b - a + 1;
        return a + Math.floor(Math.random() * range);
    }

    function getPoints () {
        return [
            { x: 0, y: between(-4, 4) },
            { x: 1, y: between(-5, 5) }
        ];
    }

    function getGradient (points) {
        return (points[1].y - points[0].y) / (points[1].x - points[0].x);
    }

    function pointString (point) {
        return '(' + point.x + ', ' + point.y + ')';
    }

    function lineString (points) {
        var line = "y = ";
        var gradient = getGradient(points);
        line += gradient + 'x+';
        line += points[0].y;

        return line;
    }

    function showLine () {
        var points = pointsCollection[qIndex];

        calculator.setMathBounds({
            left: - 2,
            right: 5,
            bottom: Math.min(points[0].y, points[1].y) - 3,
            top: Math.max(points[0].y, points[1].y) + 3
        });

        calculator.setExpression({id:'line', latex:lineString(points)});

        points.forEach(function (point, i) {
            calculator.setExpression({id: 'point' + i, latex: pointString(point)});
        });
    }

    function setTitle () {
        var title = 'Straight Lines and Gradients: ';
        var desmosTitle = document.getElementById('desmosTitle');

        if (pointsCollection.length) {
            title += (qIndex + 1) + ' of ' + pointsCollection.length;
        } else {
            title += 'click Next to create a new line';
        }

        desmosTitle.innerText = title;
    }

    function render () {
        showLine();
        setTitle();
    }

    function next () {
        if (qIndex === pointsCollection.length - 1) {
            pointsCollection.push(getPoints());
        }

        qIndex++;
        render();
    }

    function prev () {
        if (qIndex > 0) {
            qIndex--;
            render();
        }
    }

    function first () {
        if (pointsCollection.length) {
            qIndex = 0;
            render();
        }
    }

    function last () {
        if (pointsCollection.length) {
            qIndex = pointsCollection.length - 1;
            render();
        }
    }

    function clear () {
        qIndex = -1;
        pointsCollection = [];
        setTitle();

        calculator.removeExpressions([
            { id: 'point0' },
            { id: 'point1' },
            { id: 'line' }
        ]);
    }

    function init () {
        var elt = document.getElementById('calculator');

        calculator = Desmos.GraphingCalculator(elt, {
            expressionsCollapsed: true
        });

        calculator.updateSettings({
            xAxisMinorSubdivisions: 1,
            yAxisMinorSubdivisions: 1,
            yAxisStep: 1,
            xAxisStep: 1
        });

        qIndex = -1;
        pointsCollection = [];

        document.getElementById('btnNext').addEventListener('click', next);
        document.getElementById('btnPrev').addEventListener('click', prev);
        document.getElementById('btnFirst').addEventListener('click', first);
        document.getElementById('btnLast').addEventListener('click', last);
        document.getElementById('btnClear').addEventListener('click', clear);
    }

    init();
})();Declare variables
You want to be able to create multiple lines and navigate between them. To store the lines and the index of the currently shown line, you declare a couple of variables, pointsCollection and qIndex.
var calculator;
var pointsCollection;
var qIndex;
You assign the variables values later in the program, in the init function.
calculator = Desmos.GraphingCalculator(elt, {
    expressionsCollapsed: true
});

qIndex = -1;
pointsCollection = [];
You assign an empty array to the pointsCollection variable. Each line the program creates will be added to the array. Here's the array after the program has added three lines (i.e. the user has clicked Next three times).
[
    [ { x: 0, y: -2 }, { x: 1, y:  1 } ],
    [ { x: 0, y: 1  }, { x: 1, y: -1 } ],
    [ { x: 0, y: -3 }, { x: 1, y:  3 } ]
]
An array of two points is used to specify each straight line. Each point is an object with x and y properties. The straight line specified passes through the two points.
The program navigates through the collection of lines by changing the value of qIndex. To access the second line in the collection, set qIndex to 1 (arrays are zero-based). Here's an example (not from the main listing) of working with the collection of lines.
pointsCollection = [
    [ { x: 0, y: -2 }, { x: 1, y:  1 } ],
    [ { x: 0, y:  1 }, { x: 1, y: -1 } ],
    [ { x: 0, y: -3 }, { x: 1, y:  3 } ]
];

qIndex = 1;
var points = pointsCollection[qIndex];  // [ { x: 0, y: 1 }, { x: 1, y: -1 } ]

points[0].x;  //  0
points[0].y;  //  1
points[1].x;  //  1
points[1].y;  // -1
Define navigation functions
The app uses five functions to navigate between any stored lines and to clear the store:
clear: empty the store and remove any lines from displayfirst: display the first line in the storeprev: display the previous line in the storenext: display the next line or create a new linelast: display the last line in the store
Whenever the program calls the clear function, it resets the collection of lines to an empty array and sets the index of the current line to -1.
function clear () {
  qIndex = -1;
  pointsCollection = [];
  setTitle();

  calculator.removeExpressions([
    { id: 'point0' },
    { id: 'point1' },
    { id: 'line' }
  ]);
}
It also removes any existing expressions from the calculator's expressions list, leaving a pristine, blank calculator ready to show the first line in a new set. Shiny!
The first function checks if any lines are in the store, showing the first line if it exists.
function first () {
    if (pointsCollection.length) {
        qIndex = 0;
        render();
    }
}
If there are no lines in the store then pointsCollection.length will equal zero. Zero evaluates to false in the if condition, and the code in the block won't run.
If there is a line in the store then pointsCollection.length will be greater than zero and will evaluate to true, causing the code block to run. The block sets qIndex to 0, the index of the first line.
The render function updates both the points and the line shown on the calculator, and the app title shown above the calculator.
The prev function shows the previous line in the collection, if there is one.
function prev () {
    if (qIndex > 0) {
        qIndex--;
        render();
    }
}
In this context, qIndex-- is equivalent to qIndex -= 1 and qIndex = qIndex - 1. They all subract 1 from qIndex.
The next function is slightly more complicated. It performs two jobs:
- Create a new line: if the line collection is empty or if the current line is the last in the collection.
- Show the next line: if the line collection is not empty and the current line is not the last.
function next () {

    // if the current line is the last or there are no lines
    if (qIndex === pointsCollection.length - 1) {

        // create a new line
       pointsCollection.push(getPoints());

    }

    // move to the next line
    // which may be the line just created
    qIndex++;

    // show the new line
    render();
}
If there are lines in the store, then pointsCollection.length -1 will be the index of the last line. If there are no lines in the store, then pointsCollection.length -1 will equal -1. But, qIndex is set to -1 when the program first runs and whenever the program calls the clear function.
Finally, the last function shows the last line in the collection.
function last () {
    if (pointsCollection.length) {
        qIndex = pointsCollection.length - 1;
        render();
    }
}
Wire up the navigation buttons
With the navigation functions defined, it's easy to call them at the click of a button. The relevant code is in the init function:
document.getElementById('btnNext').addEventListener('click', next);
document.getElementById('btnPrev').addEventListener('click', prev);
document.getElementById('btnFirst').addEventListener('click', first);
document.getElementById('btnLast').addEventListener('click', last);
document.getElementById('btnClear').addEventListener('click', clear);
You first need to add the buttons to the HTML. You can check the HTML panel on JS Bin if you need a reminder.
Define a render function
Whenever a user navigates to a different line, the program needs to update the expression list on the calculator with the new points and line, and update the app title to report which line the calculator is showing. The render function makes both of those tasks happen.
function render () {
    showLine();
    setTitle();
}
The render function calls the showLine function which grabs the current line from the store, sets the bounds of the graph to fit the line, and updates the calculator's expressions list to show the points and line.
function showLine () {
    var points = pointsCollection[qIndex];

    calculator.setMathBounds({
        left: - 2,
        right: 5,
        bottom: Math.min(points[0].y, points[1].y) - 3,
        top: Math.max(points[0].y, points[1].y) + 3
    });

    calculator.setExpression({id:'line', latex:lineString(points)});

    points.forEach(function (point, i) {
        calculator.setExpression({id: 'point' + i, latex: pointString(point)});
    });
}
The function uses the smallest of the points' y-coordinates to set the bottom property and the largest to set the top property.
What's next?
That's it for part 2! You've built a usable classroom tool and seen how to set up a Desmos calculator to better suit your needs.
In part 3, you'll use Desmos helper functions to perform calculations, generate straight lines with fractional gradients, and tidy up the expressions in the expressions list.
Find out more about Desmos
See the calculator (and a lot more) in action at desmos.com
Investigate the API at desmos.com/api
Get Programming with JavaScript
Keep learning! Get Programming with JavaScript is published by Manning and available in print and as an ebook.
