
Desmos: Creating Grids
Grids appear in a number of mathematical investigations. For example, How many squares on a chessboard? and Shaded squares on a rectangle's diagonal. It is useful to have a quick way of creating grids as part of larger projects. This tutorial shows you how!
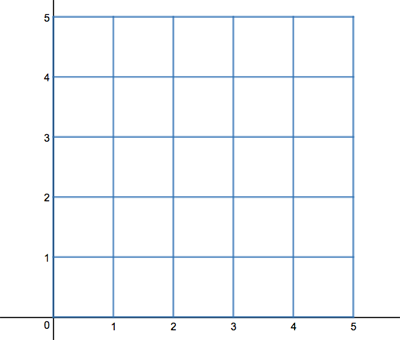
You keep things simple and create a five by five grid, shown below.
You cover the following Desmos topics:
- Removing gridlines
- Restricting how much of a graph is drawn
- Organising expressions with folders
- Changing the colour of a graph
- Duplicating expressions
- Using lists for efficiency
Setting up your new graph surface
Because you're plotting your own grid, you don't need the grid lines Desmos gives you. On a new graph on Desmos, open up the Graph Settings by clicking on the spanner (or wrench) button. Uncheck the Grid checkbox.
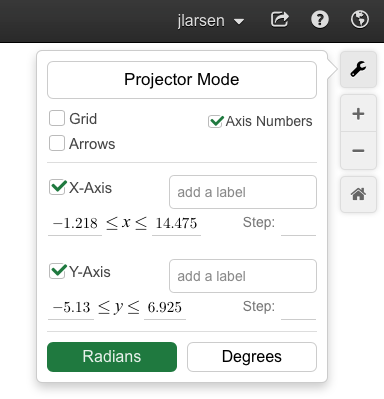
You can switch off the axes and axis numbering too, if you prefer an uncluttered, shiny grid. (I've left them on for this tutorial, to make it easier to see which lines you'll be plotting.)
Plotting two lines
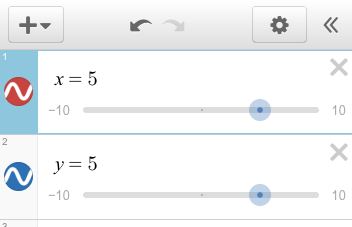
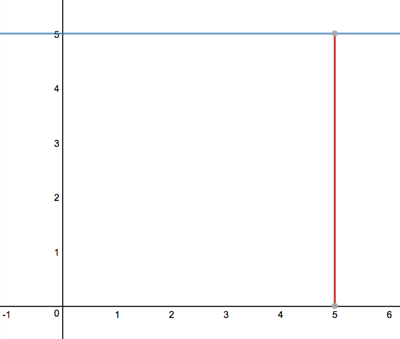
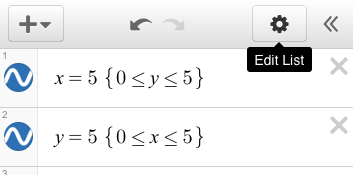
To get a feel for what's needed, start with just a couple of grid lines. Enter the expressions x = 5 and y = 5 in the expressions list. The two graphs will automatically be plotted on the Desmos graph surface. (Ignore the sliders; you won't be using them here.)
Select one of the graphs by clicking its expression or the plotted graph. You'll see a point where the two graphs cross. Click the point to display its coordinates.
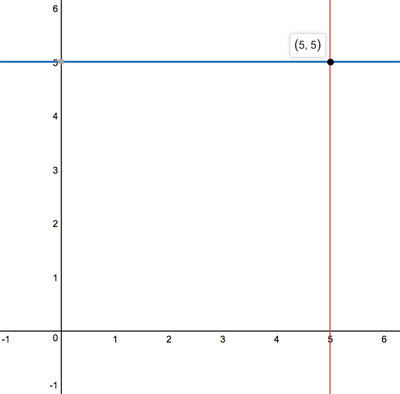
The point, (5, 5) should be the top right of your grid. However, notice how the graphs extend beyond that point, and below and to the left of the axes. How can you restrict the graphs so they just show what you want?
Adding restrictions to the graphs
You can add restrictions between curly braces after the expression for a graph. The restrictions specify how much of the graph to draw. For the line x = 5, you only want to draw the graph for values of y between 0 and 5, as shown here.
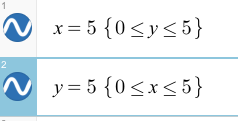
To restrict the graph, type { 0 <= y <= 5 } after x = 5 in the expressions list.
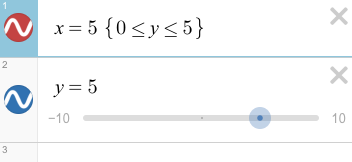
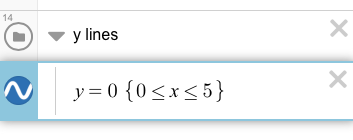
For the line y = 5, you only want to draw the graph for values of x between 0 and 5. Type { 0 <= x <= 5 } after y = 5 in the expressions list.
Consistent Colours
Desmos automatically assigns colours when you plot new graphs. You want to draw a grid with every line the same colour. Good news! You can set the colours of your graphs (at least you can choose from a limited palette).
Click and hold the graph icon, the circle with the wavy line to the left of an expression. A style menu will pop up.
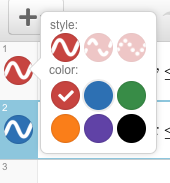
Choose the colour so your two lines match. (I've gone for blue, to match my eyes.) The graph icon's background is the same as the colour used to plot the graph.
You've drawn two lines from your grid. Only 10 more to go! First, the long way...
Duplicating Expressions
Your grid is made up of 12 lines in total, six of the form x = a and six of the form y = a. Rather than typing in a bunch of expressions, use the duplicate functionality of Desmos.
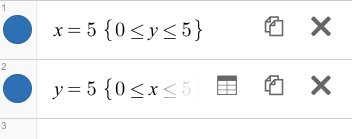
To duplicate an expression, first click the Edit List button at the top of the expressions list. (It's the one with the cog or gear icon.)
Some new icons will appear for each expression. Duplicate each expression five times. Notice how Desmos does not change the colour of a graph when you duplicate it.
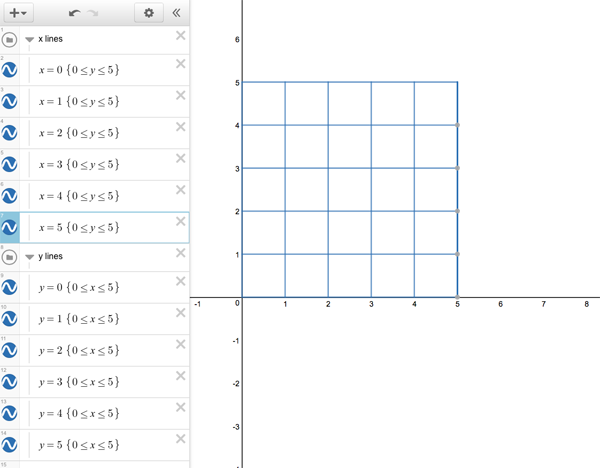
Manually edit the new expressions to produce the grid you want. (x = 4, x = 3, ...)
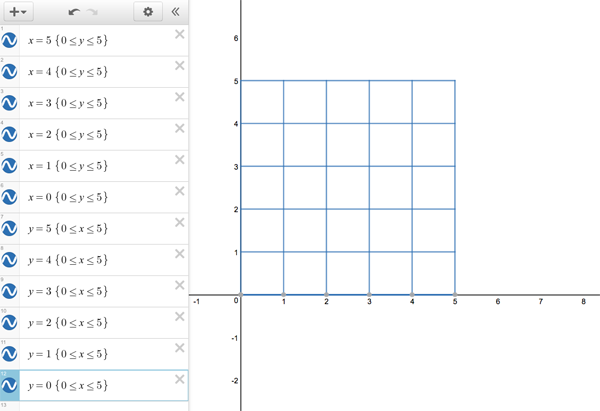
Excellent! You have the gorgeous five by five grid you always wanted. But that expressions list... super-crowded!
Using folders to tidy your expressions
More complicated Desmos projects can involve many expressions in the expressions list; it quickly becomes hard to navigate, read and reason about all those expressions. Thoughtfully named folders make your projects easier to use and to understand.
Click the big plus button to access the Add Item menu. Select the folder option. Name the folder 'x lines'.
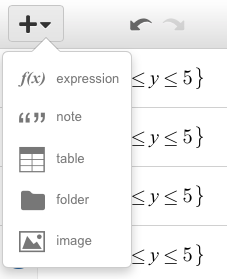
Add a second folder and name it 'y lines'.
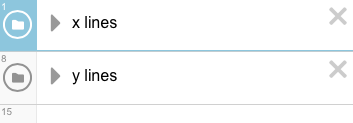
Use the disclosure triangles, to the left of the folder name, to open and close a folder, showing or hiding its contents. Notice the icon on the left of the expression is of a folder, rather than a graph. You can click and hold the small area around that icon to drag the expression up or down the expressions list.
A line appears to the left of an expression if it is being dragged into a folder.
Drag all of the x = a expressions into the 'x lines' folder and all of the y = a expressions into the 'y lines' folder.
Those folders definitely help you tidy up the inevitable proliferation of expressions. While you may end up with many expressions in bigger projects, it is often advisable to avoid such a plague if possible. For your grid, there is a neat way of plotting multiple lines at once: embrace the list...
Using a list to plot multiple graphs
A Desmos list holds multiple values in a single object. You can then use the list in a single expression to plot multiple graphs or perform multiple calculations.
First, hide your previous, long-winded version. You can click an expression's icon to toggle its visibility on the graph surface. Click the two folder icons to hide all of your grid lines.
Your grid lines are of the form x = a and y = a, where a is an integer between 0 and 5. Use square brackets to create a list of the values a can take: a = [0, 1, 2, 3, 4, 5]
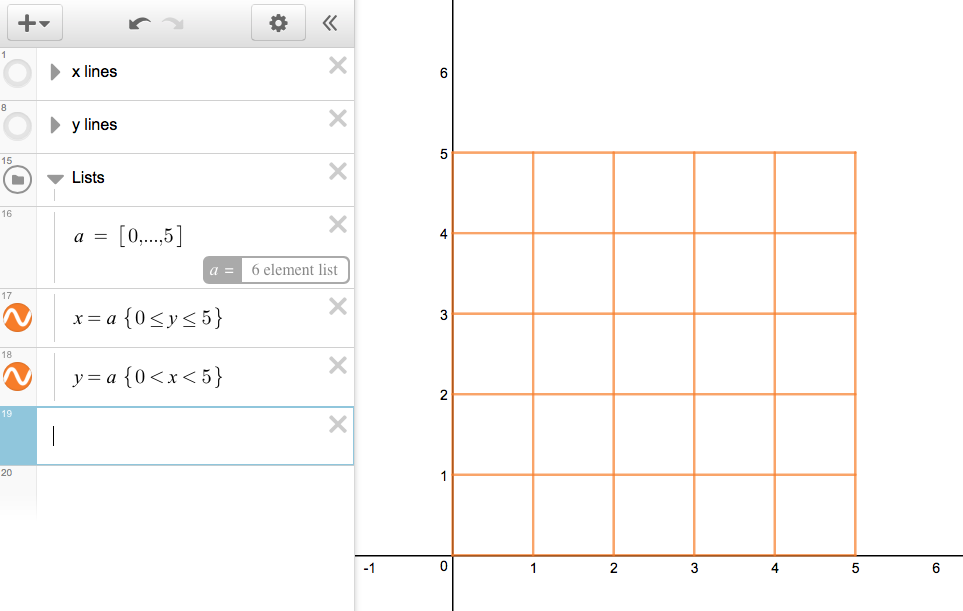
Or, even neater, use ellipses for predictable sequences: a = [0,...,5]
You can omit the commas if you like, Desmos understands either way.
Finally, to draw your grid, use x = a and y = a as expressions. Desmos will draw a graph for each value of a in the list, as shown below. Don't forget to restrict the graphs to just the segments you want.
And that's that! You have a quick way of creating grids. Try creating grids of different sizes. Can you plot rectangular grids?